

The social media reporting tool that turns data into decisions
Iconosquare's social media reporting tool automates cross-platform metrics, builds white-label reports, and delivers stakeholder-ready exports in minutes, not hours. Track every social media KPI, customize your dashboards by team or client, and prove ROI without losing your evening to spreadsheets.
Track performance metrics
Monitor engagement, audience growth, and content success.
Customize reports easily
Drag-and-drop metrics to create a custom view of your performance.
Automate reporting processes
Use AI to get insights and schedule updates for seamless data delivery.
Export branded deliverables
Generate white-labeled PDF/XLS reports in seconds.
Comprehensive
performance reports
Discover in-depth page and profile performance reports that provide essential insights into your social media presence:
• Access aggregated data for multiple profiles at the same time.
• Observe how your community grows.
• Get a better understanding of who your audience is through demographic data.
• Dive into your social media content performance and engagement analytics to see what’s working and what’s not, exploring both organic and paid metrics.
SOCIAL NETWORKS INTEGRATED


Report customization
Benefit from ready-made generic reports, or create tailored reports to suit your specific needs across multiple platforms and social profiles using our social media management tool:
- Customize every detail to focus on the metrics that matter most to your business.
- Report on any time frame you want.
- Define periods to compare the success of your social media posts.
- Add sections, text and images.

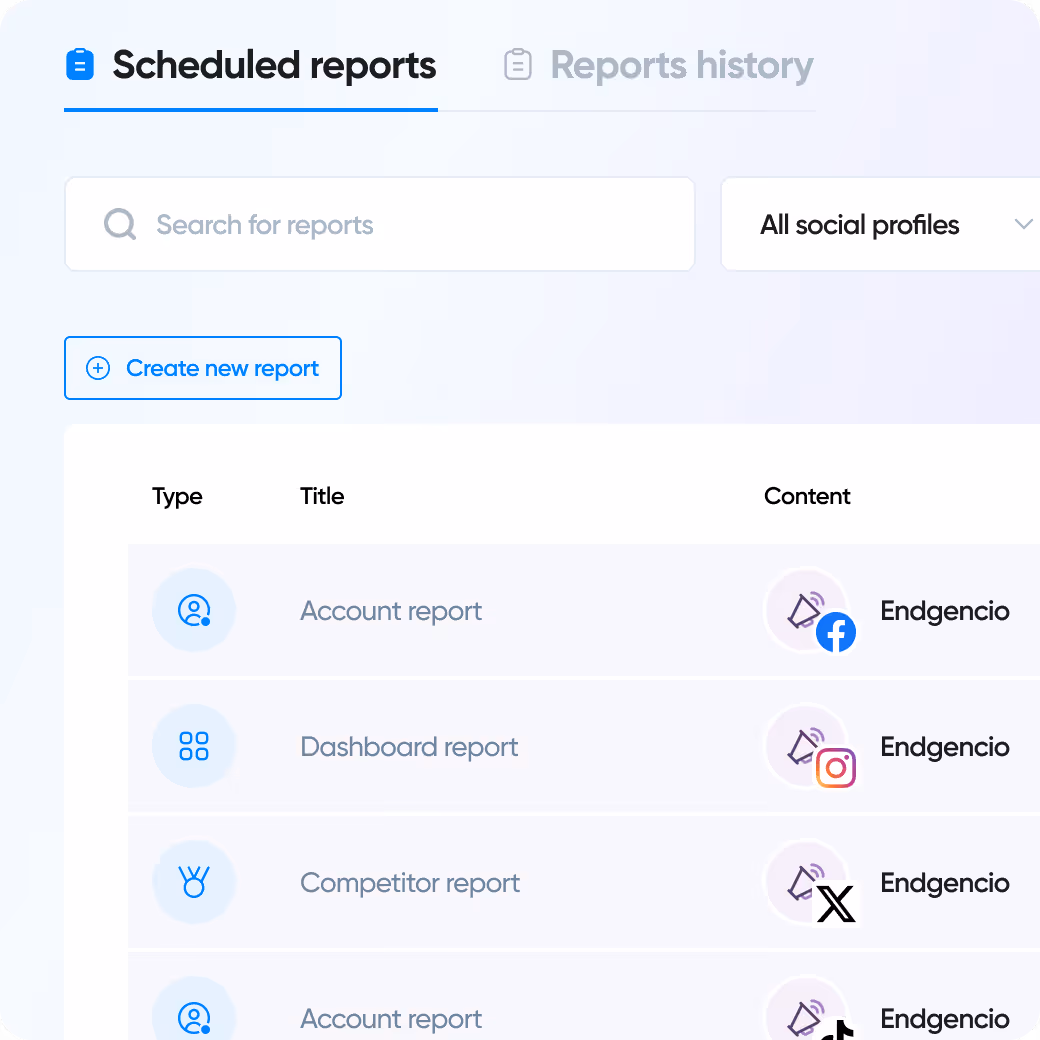
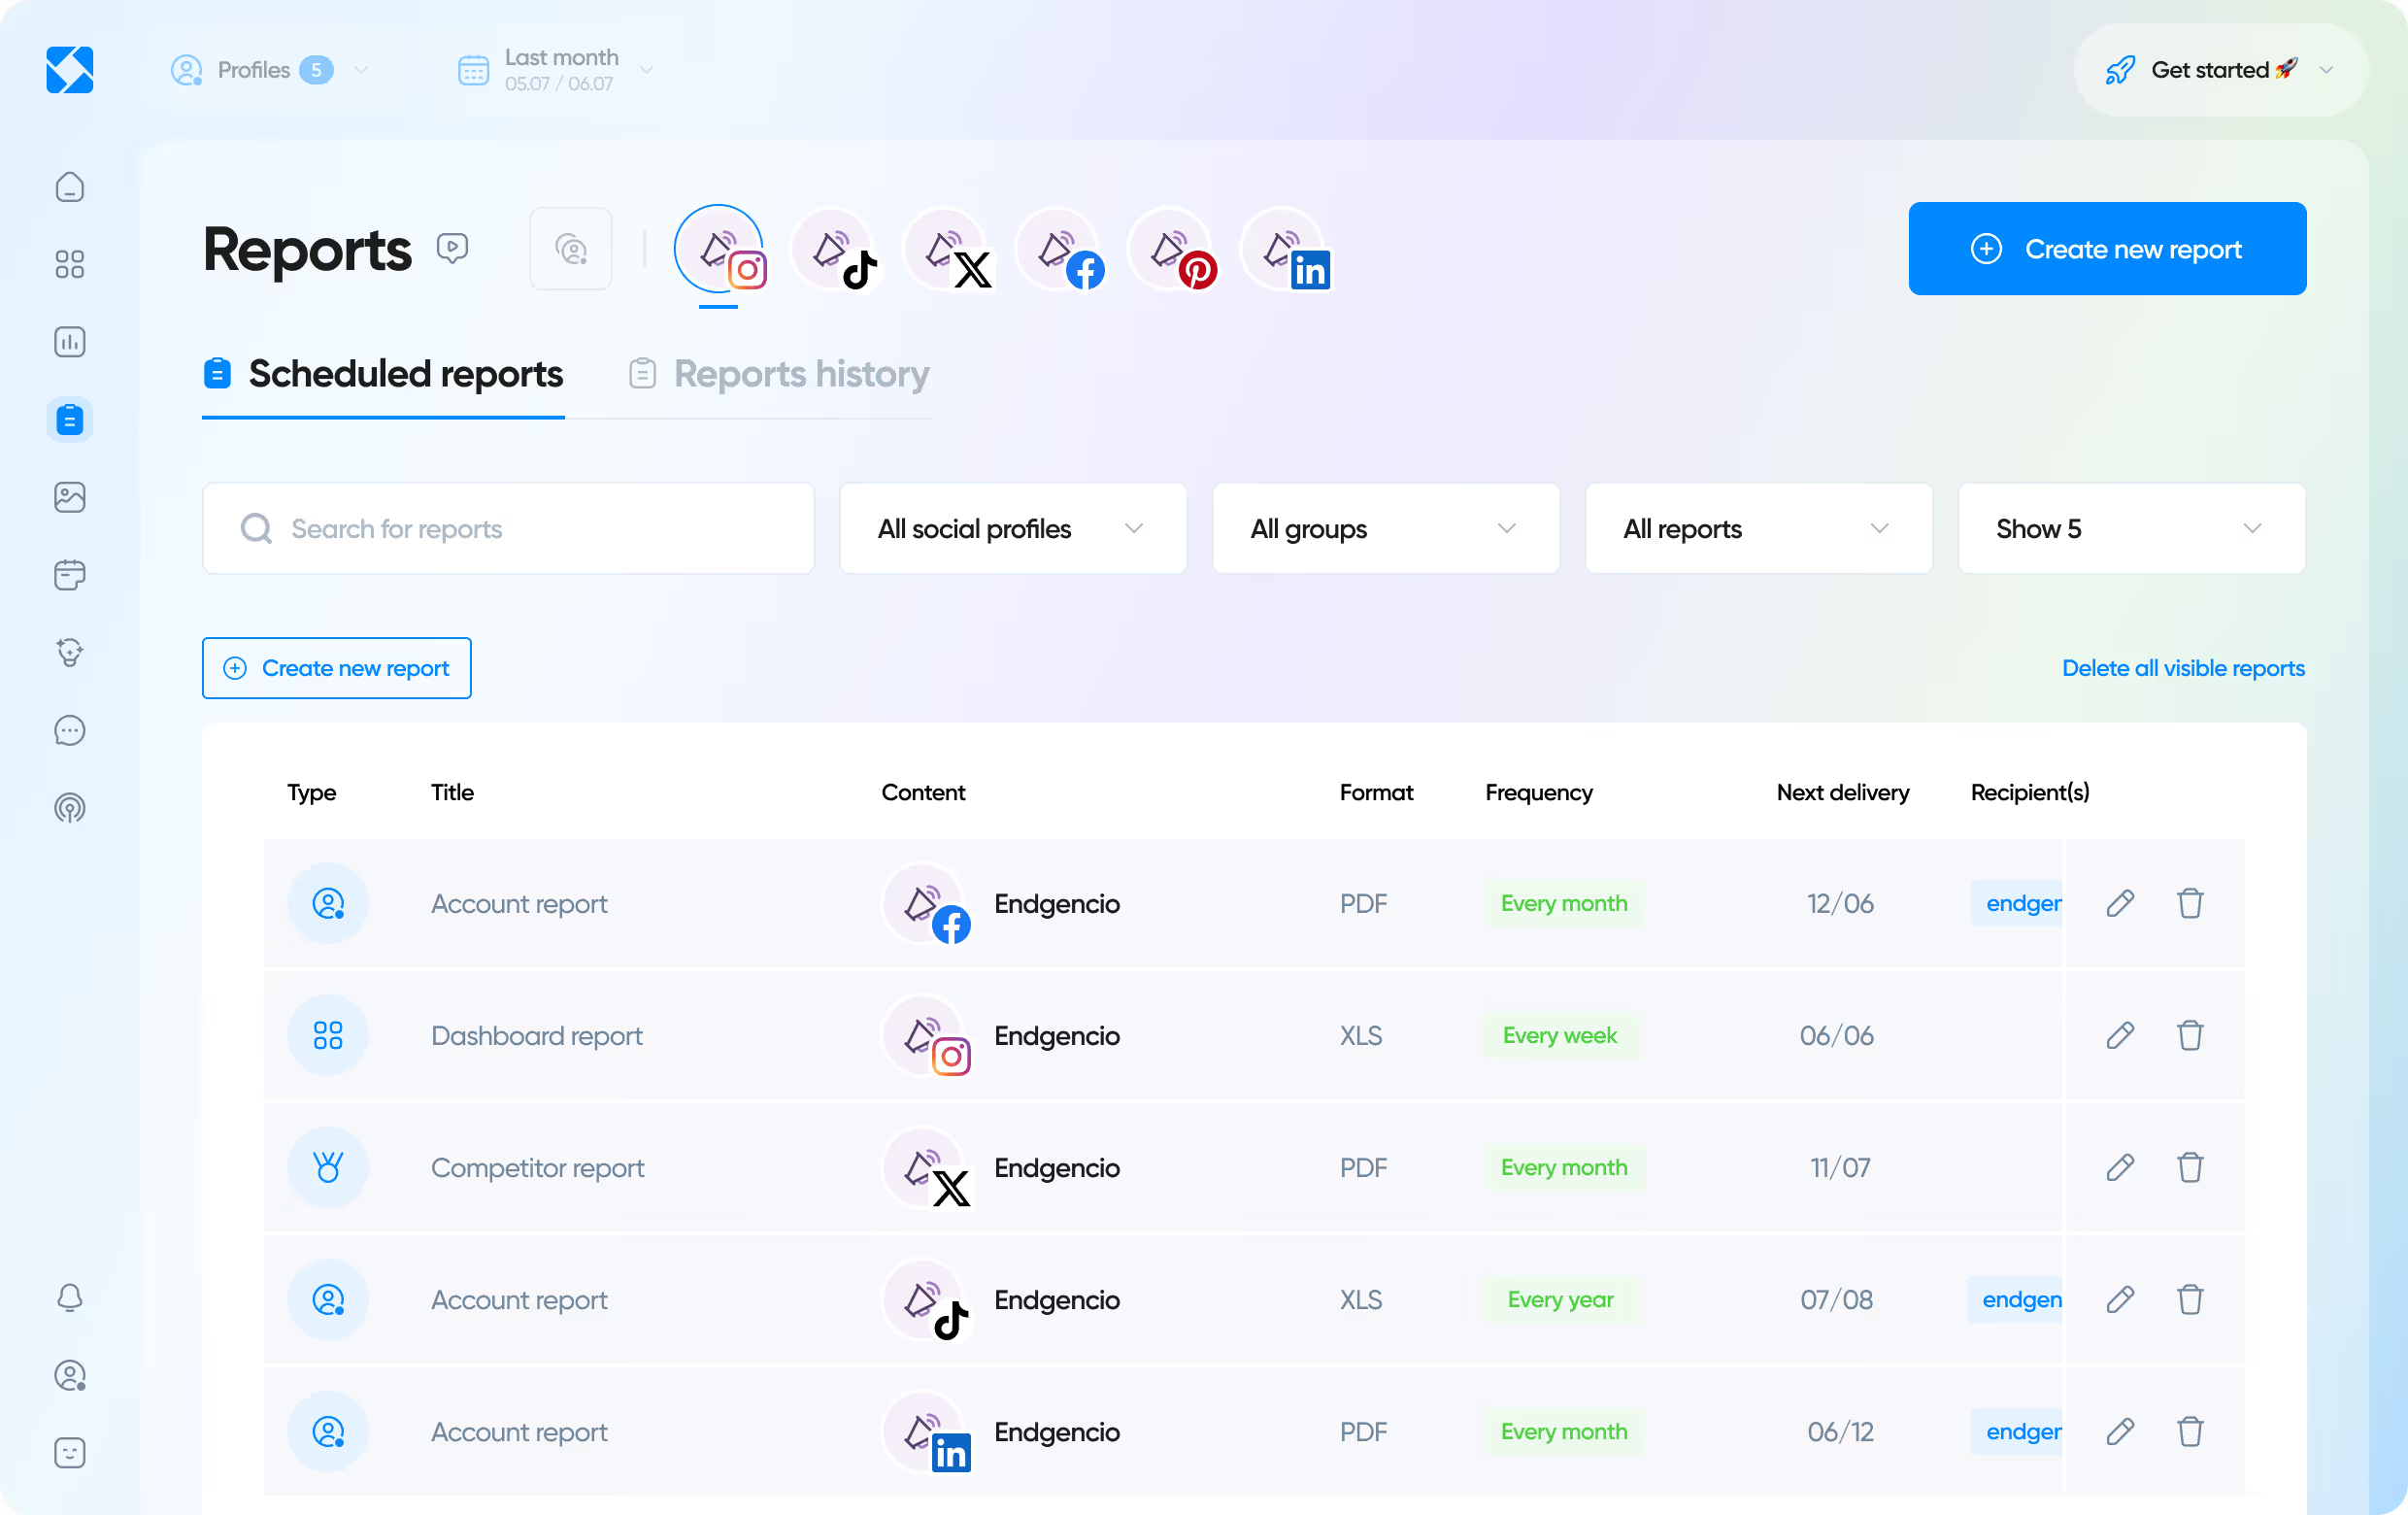
Automated and scheduled delivery
Streamline your reporting process and demonstrate your social media ROI by setting up automated reports to land in inboxes daily, weekly, or monthly. Save hours on manual updates and ensure that clients or team members always have access to the latest data regarding your social media accounts.

“I like that Iconosquare gives me in-depth tools to track and measure our growth across platforms in a customizable easy to use way. The ability to customize date ranges and export reports are especially beneficial to gaining insight into.”
Exportable reports
No need to spend hours extracting data or preparing a presentation. Your report is ready in seconds with only a few clicks. Export presentation-ready reports in the format that suits you best (PDF or XLS) and personalize them with your company logo thanks to our white-label feature. Prefer to work in your AI tools? With the Iconosquare MCP, pull your reporting data straight into Claude, ChatGPT, or Gemini and ask questions about your performance there.

Competitors reports
Compare your performance against industry leaders and uncover market trends with detailed competitor analysis. Track their follower growth, posting frequency, engagement rates, and audience demographics to spot trends.

“The insights available made monthly reporting a breeze at our agency. The format of everything was super intuitive and it not only saved our team time but gave deeper insights than most platforms allow.”
Hashtags reports
Track relevant hashtags to analyze their usage across different formats on social networks. Monitor the likes and comments generated by each hashtag to assess their effectiveness on your target audience.

Social media report example with Iconosquare

“Easy to use, with clear and concise reports. The visual layout makes it easy to see results.”
Frequently Asked Questions
What is a social media report?
Social media reporting is the process of analyzing and summarizing your social media performance over a specific period. A social media report is a document that outlines your social media performance metrics, and highlights key insights.
How often should you produce a social media report?
The frequency of your reports can vary based on your goals, but a good rule of thumb is to create monthly reports. This approach allows you to track trends over time while remaining agile enough to make adjustments as needed! On Iconosquare, you can schedule reports to be sent daily, weekly, monthly, quarterly or annually.
How to create a social media report?
To create a social media report, start by defining your goals, gather your social media metrics, analyze the results, and present your findings in a clear and visually appealing format. To help you save time, on Iconosquare, you can take advantage of automatically generated reports.
Simply choose your social network(s) and a time period, and the report will show you the most important KPIs. You can also create your own dashboards very simply, with drag and drop, so you can choose which data you want to focus on.
You can schedule all your reports, so they are automatically sent to you at the frequency you want.
Does Iconosquare have Campaign reports?
Yes! You can organize your social media posts into a campaign in order to focus on one campaign in particular! We offer you automatic campaigns (labels, periods...) but you can also set up manual campaigns by selecting posts.
Why is social media reporting important?
Social media reporting is crucial because it provides insights into your audience's behavior and engagement. By understanding what resonates with your followers, you can refine your strategy, boost engagement, and ultimately drive better results for your brand, improving your social media ROI!
How long does it take to create a social media report?
Creating a social media report can take anywhere from a few hours to a couple of days—unless you use Iconosquare! With our social media management tool, you can streamline the process and save valuable time. You’re just one click away from your first dashboard!
What KPIs should you use in social media reporting?
Common KPIs for social media reporting include engagement metrics (likes, comments, shares, video views, etc.), engagement rate, reach, impressions, follower growth, and click-through rate.
These metrics help you gauge the effectiveness of your social media efforts. With Iconosquare, your social media analytics tool, you can choose from over 100 metrics!
How do you build the industry benchmark?
Benchmarks are based on other Iconosquare users from within the Industry you selected for your Facebook Business pages and/or Instagram Business Profiles.